Forecasting; (FRCT) FAQ MENU Why? The Home Value Forecaster is a great Trend Indicator of Market Changes for individual home owners and investors as it offers both the Positive and the Negative Forecasts The #2 Real Estate Question "is this a good time to Sell or Buy? In other words is the the market going up or down?
To Calculate your Home's Future Value Forecast + or -, firstly find the correct City and Home type (Single Family Detached, Condo or Townhouse). Now click View 2 Year Forecast to see the forecasts for your home that are based on the votes of our active Realtors. Customize Your Own Forecast: you can input Your Own Personal Forecast Annual Values for the both the Positive and Negative changes for next year and the graph will change accordingly.
Final adjustments to increase accuracy: The VMR Forecaster value is based on the subject home being in the same relative condition in the future . How Accurate are the forecasts: Our Forecasting Algorithm is based on an active survey of top Realtors in the Lower Mainland. We are asking 1,000's of agents that sell the top 90% of the Real Estate to give us their opinion on the future market changes. Please vote now! I highly recommend Agents review the latest economic news and the direction of the our Canadian Finance Minister, our Bank of Canada Governor and our own Economic Forecaster from BC CREA (Links). Currently all of our Market Forecasts are based on Single Family Detached Homes. How it works: One single Home Price Index spanning Detached Homes and Condos and Townhouses for all price bands does not work as they represent very different buyer groups and financing . Any city can have one market segment go up while another goes down; for example in Burnaby since June 2008 we see a 34% increase in High End ( Top 50%) Single Family Detached Home Values, at the same time we see a 23% increase in the Lower 50% SFD and a 2% decrease in Condos prices. To increase the accuracy of our Forecaster we have broken all Markets into Home types: SFD , Condos and Townhomes and then we further split out the Top 50% and the Lower 50%. (YTD Market Changes for 14 cities Click Here) (*Note: We build out HPIp's in 2-3 new market areas per month, do put in your request for a missing area.)
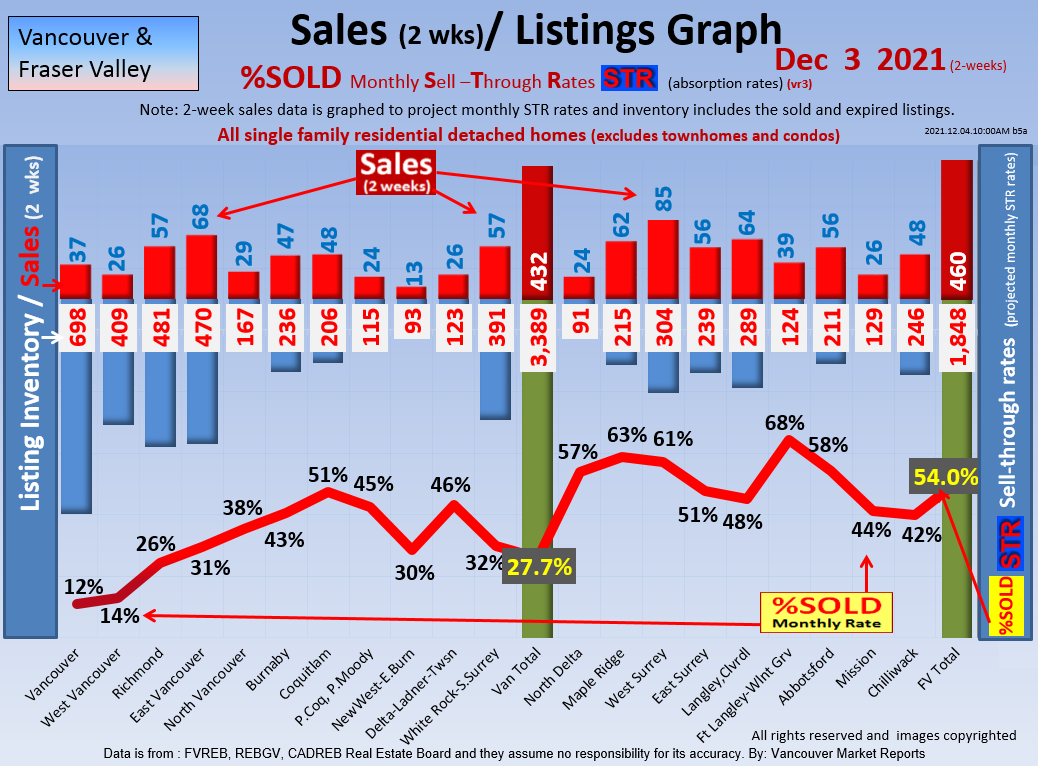
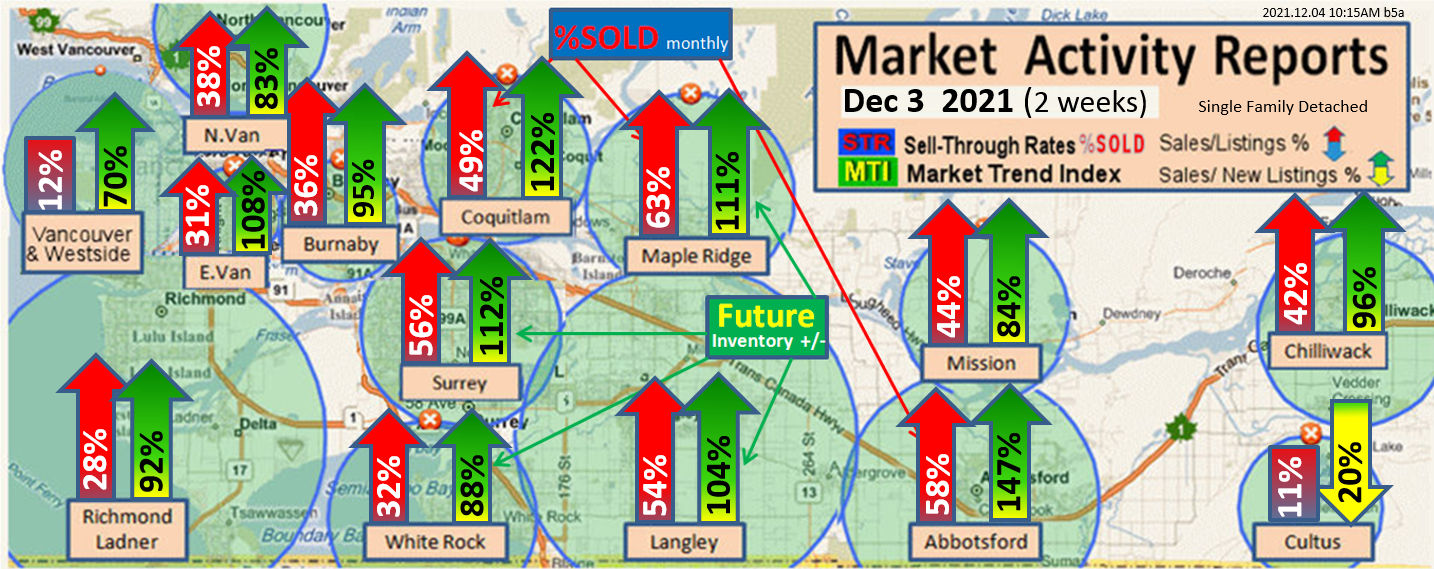
%SOLD Absorption Rates ( STR the Sell-Through-Rates/month) FAQ MENU
This is a very useful tool to determine if the Market is going Up or Down at this exact time to help our Sellers recognize the Best Price
We update the %SOLD rate for all lower mainland cities every two weeks so you and your clients know if we are in or trending towards
Sales: How are they calculated? The Sales in the Monthly STR are calculated using the date the Sale is reported and Processed by the individual Real Estate Boards. How do we Determine the STR with 2 weeks of data? The %SOLD rate is always reported as a monthly index (see the math) Why this date? ...It is because the Sold Date is a Moving Number. How? ...There is a varying time lag of the Sales being reported to the Real Estate Boards, so the same Sales numbers can vary from week to week. Good Realtors monitor the Sales Activity weekly to keep apprised of Market Activity. Let’s say we count 20 sales for last week for Single Family Detached Houses within a specific Board Area and then review the Sales Activity for the whole month. Then we check that same Sales Total the following month to see the Sales numbers went up by 30% ... not good. By using the methodology in the REMAX Market Reports (although harder to collect) we get a much cleaner and accurate Sales Count. What provides the True Picture... Active or Total Monthly Listings? To provide the most accurate picture of Monthly Sales Activity, the REMAX Market Reports uses the Starting Monthly Inventory PLUS Newly Listed Properties for that Month PLUS The Expired Listings for that Month PLUS the Canceled and Terminated Listings to create the Total Listings marketed for that month. Using All Properties Available for Sale during the Month: 15 Sales Out of 100 Total Listings Marketed for the Month= 15 %SOLD rate for the month. Does the 25 %SOLD rate mean prices will go up or down? After studying the %SOLD - Sell-Through (absorption) month rates for 28 years we have learned that it totally depends on the previous market history; for example if the market has been a Buyers Market Let me explain: In a market with a low 12 %SOLD for months where the average seller is discounting 7% from "list to sell" then they experience a jump to 25 %SOLD those sellers would immediately reduce their discounting and could even result in their homes selling for MORE than the list price.. So here we see a 7% increase in just a few weeks with 25 %SOLD rate. Then if the market is been records setting high amounts like 35 %SOLD rates and sales at $40,000 over list and then the sellers are no longer getting multiple offers and are actually coming down 3%. then at 25 %SOLD sold rate prices just drop $50-60 thousand dollars. Note: the STR %SOLD rate is always reported on a monthly rate ..;. so when looking at 2 week reports do remember that the %SOLD rate is adjusted to a 4 week rate so they are relatively consistent. eg: 2 weeks of sales over Inventory times 2.2 weeks in a month= the MONTHLY %%SOLD rate. Market Trend Indicators ( MTI ) FAQ Menu Predicting the Future Market Conditions to Determine the Best Pricing Strategy for Success in any Market These are the forward projections we use to assist our clients to maximize their sales price based on Increasing or Decreasing Inventory Levels. It’s a wonderful tool demonstrate to how see 1-2 months into the future. Very simply; as New Listings come on each month, we need between 39-64% of THOSE New Listings Amount to sell DURING THAT MONTH. If the ( MTI ) is LESS than 39% of that NEW Added Inventory SELLING during that same month, then the NEXT MONTH’S Total Listing Inventory will INCREASE. OR: If the ( MTI ) is MORE than 64% of that NEW Added Inventory SELLING during that same month, then the NEXT MONTH’S Total Listing Inventory will DECREASE. This is Predictive Market Forecasting, which has been tested and proven over the past 25+ years, and provides a high degree of accuracy. (+/- 3% 17 out of 19 times.) If the Market Trend Index ( MTI ) is showing a clear pattern of ongoing Increasing Inventories along with Weak Sales Activity (Below 12%), we recommend to “Price Ahead of the Curve” to avoid being drawn with the masses into the probable Downward Market Trend, Get Your Property Sold, and then you can TAKE ADVANTAGE of the future Buyer Market Conditions. In a Buyer’s Market, when you have extra inventory on the market and anxious sellers you can get that BEST PROPERTY- BEST LOCATION- GREAT VALUE WIN. TOP Projecting Buyer Confidence and Purchasing Capacity FAQ Menu Different Buyer Groups equal different Consumer Confidences: Local Buyers confidence are subject to elections, employment and money supply changes where as the foreign investor can be oblivious to such issues. Case in point: when the S&P downgraded the American credit rating in August 2011, we had an immediate 33% drop in sales in the West Vancouver/Vancouver/Richmond-Chinese corridor area, with virtually NO ONE receiving multiple offers in those markets. Meanwhile, in the Fraser Valley, the S&P Downgrade made a minimal difference. Previously it was February 2011, it was the Mainland Chinese Buyers that bolstered the Market Activity. In February 2012, it was it was the Local Buyers confidence fueling the Market Activity. This is why we study both Consumer Confidences to provide more accurate Buyer Activity Projections.
Government Factors We all remember the uncertainty caused by the Introduction and then Removal of the HST. It caused a massive drop in Consumer Confidence throughout all areas of the Economy and in general, un-necessary hardship on the Public. From a different angle, here in the Lower Mainland, we live in the Jewel of the North American West Coast, offering a temperate climate, with an Economy, Political System, Schools, and Health System, which are the envy of the rest of the World. People WANT TO LIVE HERE. New Canadians means NEW MONEY, directly entering our Local Economy. It is definitely a factor which has affected our ongoing Home Values. In July of 2012, the Government of Canada suspended the Federal Immigrant Investor Program, causing an almost immediate slowdown in Market Activity. This is why we monitor and study Government Policies to allow us to project Market changes and determine Best Strategies for Success. (Note; those investors injected Billions into our economy: we had applications for 3,2000 Immigrants/ year with a minimal net worth of ?1.8 million dollars)
Banking Policies: Credit and Money Supply In July of 2012 the Banking Mortgage rules reduced the 30 year amortization from 30 years to 25 years. This tightening of credit is reputed to have reduced our qualified home purchasers by 20%. Thus we saw a substantial drop in sales over the next 6 months.
Economic Indicators/ Employment Different Economic Indicators are published by different bodies and available for those interested. An example is below: Canadian Manufacturing Sales - January 18, 2013 Canadian manufacturing sales increased 1.7 per cent in November, following a 1.4 per cent decline in October. Sales rose in 12 of 21 manufacturing industries. Adjusting for inflation, Canadian manufacturing sales were 1.6 per cent higher in November. With the release of November's manufacturing and trade data, we estimate that the Canadian economy grew approximately 1.7 per cent in the fourth quarter of 2012. Sales in the BC Manufacturing Sector rose 1.2 per cent in November, and were 4.3 per cent higher Year-over-Year. Primary and Fabricated Metal Manufacturing, (which accounts for 13% of BC Manufacturing, was up 4.5% in November, while Forestry Products (30% of BC Manufacturing Sales) were up just under 1 per cent, and Food manufacturing (17% of BC Manufacturing Sales) was up 1 per cent. We monitor and study Economic Indicators to monitor the ongoing strength of the Canadian and BC Economies, to determine the ability of Local Buyers to purchase. Marketing your newsletter For me the RE/MAX market reports are emailed every month with about a 20% readership.. post on Facebook and Print every 3 months minimum
Note if you do not print as an image your words get condensed and may look unreadable Assistant Services: Newsletter printing, emailing or office administration:
Service offered: We will print your full color pages for .45 each plus delivery .. 48 hr service We will MAIL your newsletter for you We will email your newsletters for you.. .. are doing more office work than actually talking to clients??? Data Fields: DOM, %Discount Rates, Most data is based on Medians instead of averages and the data is calculated on Processed date not Sales date. Days On Market ( DOM is calculated using the median of the all the sales. In a few cases where their are limited our usual sales eg: 5 sales and 3 of them are 3 days in 0 days, 1 at 118 days and 1 at 18 days we report the median of - days. this would be marked as limited data.

LIVE SUPPORT |
|


|
Bill Coughlin 's Personalized Market Reports TOP
Hi Bill since July about 756 RE/MAX agents have used these reports and the data in their CMA's, Price Reductions and and News Content that was sent to 10,000's of their clients and now they earned extra commissions. OK do step forward and let us help you! Today these easy to understand "All-In-One" RE/MAX Market Reports will impress your clients and make you $$$'s. Bill, who else are using these reports....read all the recommendations...... and we would sure appreciate your comments on Elton Ash's blog on these RE/MAX Reports Click Here
Download sample sponsored BE-ALL REMAX Market Reports here. |

 Offering:
|
Bill Coughlin TOP 1-888-539-4664 (tollfree) Skype: BillCoughlin
Hello Bill fellow Re/Max Agent.. please enjoy and use these reports to assist you in closing that next listing.
The VancouverMarketReports.com has even more detailed listing aids (reports every 2 weeks) |